
2174 words 8 minute read - Let’s do this!
Yep, it really is sweater weather already - If September was supposed to be the month freight finally settled down, somebody forgot to tell the freight market. This week, ocean rates are climbing into China’s Golden Week, U.S. intermodal volume just snapped back after last week’s decline, trucking capacity is sending some very mixed signals, diesel has somehow found another gear, and the Strait of Hormuz is reminding everyone why geopolitical risk belongs in a logistics conversation. The interesting part is that none of these stories exists in a vacuum. Expensive diesel changes truck economics. Tight truck capacity makes intermodal more attractive. Strong intermodal demand changes inland planning. Higher bunker costs and blank sailings affect ocean pricing. And instability thousands of miles away can work its way into a transportation budget remarkably quickly. So this week, instead of asking whether the freight market is “tight” or “soft,” we're looking at where the pressure is actually building. And don’t forget to follow Port X Logistics on LinkedIn for real-time insights—or have our Thursday Market Updates delivered straight to your inbox by reaching out to Marketing@portxlogistics.com.
THE PRE-GOLDEN WEEK OCEAN MARKET IS GETTING EXPENSIVE. China's Golden Week begins October 1, and the normal pre-holiday shipping rush is colliding with something shippers don't particularly enjoy: carriers managing capacity while demand remains stronger than expected. Asia-to-U.S. container rates moved higher again this month. Recent market assessments put Asia/U.S. West Coast rates roughly between $7,075 and $8,330 per FEU, while East Coast rates were running between approximately $9,165 and $12,000 per FEU — their highest levels since mid-2022. The Shanghai Containerized Freight Index has also posted eight consecutive weekly increases, rising more than 20% over that period.
And price isn't the only issue. Carriers continue to use blank sailings around Golden Week to manage available capacity. Booking rollovers and inconsistent vessel schedules are creating situations where cargo may technically have space but still leave several days later than originally planned. In some cases, the combination of a rollover and delayed vessel departure can push the total delay toward two weeks.
That's an important distinction. A shipper can successfully negotiate an ocean rate, receive a booking confirmation and still lose a week somewhere between cargo ready date and actual vessel departure. At that point, the cheapest rate on the spreadsheet becomes considerably less impressive.
What It Means for Shippers
If you have Asia-origin cargo moving over the next few weeks, treat vessel departure reliability as seriously as the rate. Build additional lead time around Golden Week, ask about blank sailings before confirming the booking and understand the carrier's rollover policy. For critical cargo, compare the cost of a more reliable sailing against the cost of missing a delivery date. Right now, space isn't the whole story. Schedule integrity matters just as much.
RAIL JUST FLIPPED THE SCRIPT FROM LAST WEEK. Last week we talked about a softer national rail number. One week later? Rail apparently decided it didn't like that storyline. U.S. railroads moved 535,663 carloads and intermodal units during the week ending September 19th, an increase of 4.9% from the same week last year. Carloads increased 2.4% to 234,207, while intermodal containers and trailers jumped 6.9% to 301,456 units. That's a significant reversal from the prior week, when total traffic had fallen 3.7% year over year and intermodal was down 4.1%.
More importantly, the longer-term numbers continue to show underlying strength. Through the first 37 weeks of 2026, U.S. intermodal volume is up 4.1% year over year, carloads are up 2.7%, and total combined rail traffic is running 3.4% ahead of 2025. Across North America, combined weekly rail traffic was also up 4.6% for the latest week. That's why we don't panic over one bad week — or celebrate too much over one great one. But the rebound does tell us something useful: intermodal demand is very much alive, and with truck operating costs rising, that demand has another reason to stay healthy.
What It Means for Shippers
Keep intermodal in the conversation, particularly on longer-haul freight where an extra day or two of transit doesn't destroy the delivery plan. But don't assume rail is sitting around waiting for freight simply because last week's number was down. With U.S. intermodal running more than 4% above last year, advance planning still matters. Compare truck and rail based on realistic door-to-door transit, fuel, drayage and accessorials — not just the linehaul. Sometimes the cheapest transportation mode changes before your routing guide does.
TRUCKING IS SENDING TWO COMPLETELY DIFFERENT SIGNALS. Here's one of the more interesting freight stories right now: August truckload spot rates fell sharply, but underlying truck capacity remains remarkably tight. DAT reported that August national spot linehaul rates dropped 20 cents per mile for dry van, 14 cents for reefer and 20 cents for flatbed — the steepest July-to-August decline for all three equipment types in DAT's 16 years of tracking. Dry van spot linehaul averaged $2.19 per mile, reefer $2.61 and flatbed $2.70. That sounds like a soft trucking market until you look underneath it. ACT Research reports aggregate DAT contract truckload rates at $2.52 per mile in August, up 18% year over year. ACT's Driver Availability Index tightened to 35.9, while available spot equipment capacity was described as being at decade lows. ACT expects tight capacity and modest demand improvement to maintain upward pressure on freight rates over the next 12 to 18 months. So what gives? August experienced a significant seasonal rate correction after unusually strong June and July conditions, but the structural supply side of trucking hasn't suddenly become loose. That's why the market can simultaneously produce falling monthly spot rates and tight underlying equipment availability.
What It Means for Shippers
Don't mistake a temporary spot-rate dip for a return to unlimited cheap trucking capacity. Use softer moments to secure dependable carrier relationships and review contract pricing rather than waiting for the market to tighten visibly again. And if you're budgeting for Q4 or 2027, don't automatically assume today's spot opportunity represents tomorrow's transportation cost. This market still has less cushion than it appears to have.
DIESEL: YES, WE HAVE TO TALK ABOUT IT AGAIN. We promise we aren't trying to turn this into the Weekly Diesel Newsletter. Unfortunately, diesel refuses to stop giving us material. The national average on-highway diesel price reached $6.529 per gallon for the week of September 21, according to the U.S. Energy Information Administration. That's another 24.4-cent increase in one week. Go back to August 31, when diesel averaged $5.599, and the increase is now 93 cents per gallon in only three weeks. The Midwest reached $6.680, while the Central Atlantic climbed to $6.546. The bigger story this week, however, isn't the pump price. It's inventory. U.S. diesel inventories fell to 107.9 million barrels in mid-September — the lowest level recorded for this time of year since EIA records began in 1982. EIA expects U.S. distillate inventories to fall below 100 million barrels and remain below the five-year low through the end of 2026 and much of 2027. Industry participants told Reuters that the global shortage, driven in part by supply disruptions related to conflicts involving Iran and Russia, may not materially ease before next year. That changes the conversation from “diesel had a bad few weeks” to “elevated fuel costs may be something supply chains need to manage for a while.”
What It Means for Shippers
Stop treating current fuel surcharges as a temporary September annoyance when building transportation budgets. Model multiple fuel scenarios into Q4 and early-2027 planning, understand exactly which EIA benchmark your carrier agreements use and look for unnecessary miles in your network. Consolidating deliveries, reducing empty repositioning, using drop programs and comparing rail on longer lanes can suddenly produce meaningful savings when every unnecessary truck mile costs more. At $6.529 diesel, efficiency isn't just operational. It's financial.
HORMUZ JUST REMINDED EVERYONE THAT THIS ISN'T OVER. Last week we talked about some container services cautiously returning to Suez. This week provides a very important counterpoint: improving conditions on one Middle East route do not mean the region has stabilized. Only two commodity vessels were recorded crossing the Strait of Hormuz on Monday, September 21, down from ten the previous day and dramatically below the pre-conflict average of roughly 125 large commercial vessels per day. Reuters also reported attacks on two vessels in the Strait that day; both continued without towing, and responsibility for the incidents had not been established at the time of reporting. Some vessel movements may also be undercounted because ships can operate with AIS transponders turned off. For U.S. shippers, the connection is energy. Hormuz remains one of the world's critical oil and gas corridors, and disruptions there are feeding the same global fuel shortage now showing up in diesel, bunker costs and transportation surcharges. This is also one reason ocean pricing deserves attention beyond normal supply-and-demand fundamentals. Recent China-to-U.S. East Coast spot rates have approached $11,000 per FEU while marine bunker fuel costs have surged alongside the Middle East conflict.
What It Means for Shippers
Don't assume geopolitical risk matters only if your freight physically travels through the Middle East. Your container may never come within thousands of miles of Hormuz and still feel the effect through bunker surcharges, diesel, carrier capacity decisions and transportation pricing. For critical international freight, ask about routing, surcharges and contingency plans — and keep some schedule and budget cushion available. Geography doesn't contain supply-chain risk nearly as well as we'd like it to.
Put everything together and this week's freight market has a pretty clear message: don't let one number fool you. Ocean rates are climbing even as we approach the traditional post-peak period. Rail went from a down week to a 6.9% intermodal gain. Truckload spot pricing softened sharply while underlying capacity remains tight. Diesel has risen 93 cents in three weeks. And geopolitical disruption continues to work its way into freight costs whether cargo touches the affected region or not. The market isn't moving in one direction. Different pieces are moving at different speeds — and occasionally in completely opposite directions. That's why the smartest transportation strategy right now isn't predicting exactly what happens next. It's building enough flexibility that you have options when it does.
Compare modes. Watch the all-in cost. Question the schedule. Know your alternatives. And don't wait until the freight is already late to start looking for Plan B. We'll keep watching the moving pieces — so you can keep your freight moving.
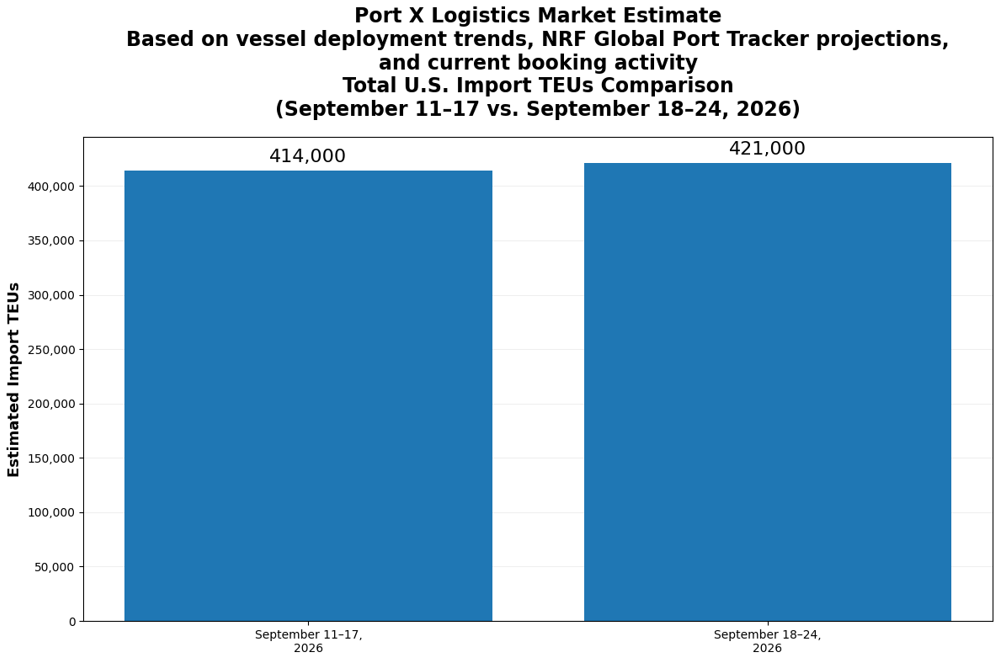
TEU volumes went up 1.69% over last week, with majority coming into New York/New Jersey 15.8%, Los Angeles 17.9% and Long Beach 14.7%
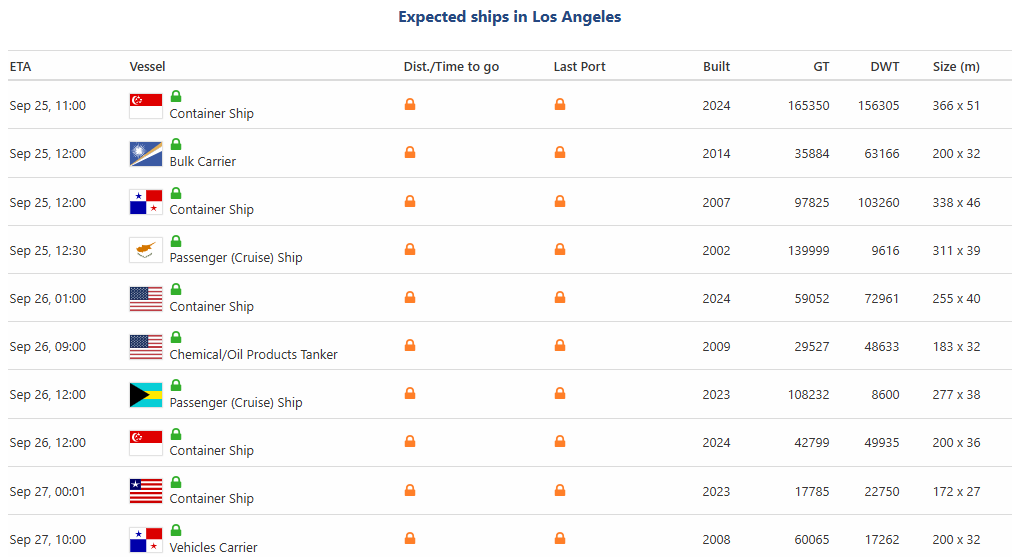
What’s happening at the ports and rails?: LA/LGB: Los Angeles and Long Beach are moving plenty of cargo, but rail-bound containers are spending noticeably more time sitting at the terminals. In August, containers destined for rail averaged 6.75 days of dwell, up from 6.34 days in July and the highest level seen over the past 12 months. Meanwhile, truck-bound containers averaged just 2.95 days — meaning the bigger pressure point isn't necessarily getting containers off the ship, but getting some of that freight moving inland by rail.
What It Means for Shippers
If your LA/LB freight is rail-bound, don't build your delivery plan around vessel arrival alone. Watch actual rail availability and departure closely, and for time-sensitive freight, compare transloading and trucking inland as an alternative. Six-plus days of rail dwell can change the economics quickly — sometimes paying a little more to get the freight moving costs considerably less than waiting for the cheaper option.
When LA/LB gets complicated, flexibility matters. Port X is staying close to terminal conditions and adjusting alongside changing gate hours, appointment availability and cargo flow to keep our customers’ freight moving. Our goal is simple: spend less time reacting to terminal challenges and more time getting containers out and on their way. And we have the operation to back it up. With competitive transload rates in Los Angeles and Long Beach, secure yard access, flexible storage, real-time OpenTrack visibility and our No Demurrage Guarantee with 72-hour dispatch, Port X gives shippers more control over what happens after the vessel arrives. Fewer handoffs. Fewer surprises. Less terminal drama. More freight moving exactly where it needs to go. Have West Coast freight that needs a better game plan? Send it to letsgetrolling@portxlogistics.com and let’s get rolling.
Did You Know? Kansas City is kind of a big deal for Port X. Every day, we put 100+ GPS-equipped power units to work across the KC market — backed by a massive 66-door facility built to do a whole lot more than just move containers. From drayage, consolidation and cross-docking to distribution, storage, automotive exports and specialty cargo, our Kansas City team keeps freight moving from one operation under one roof. And because the facility is also a fully bonded U.S. Customs CFS and exam warehouse, we can help take even more steps — and headaches — out of the process. Big capacity. Serious capabilities. One Port X team. Have freight moving through Kansas City? Email letsgetrolling@portxlogistics.com and put us to work.